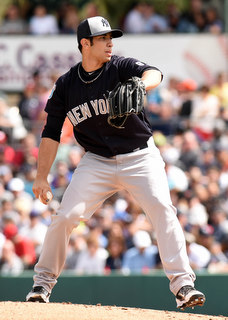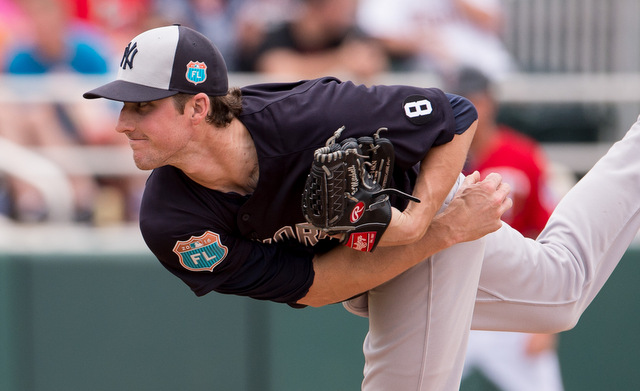
Since the start of last season, Statcast has opened our eyes to all sorts of cool stuff that we knew existed in baseball, but were unable to measure. Exit velocity, outfielder first step quickness, things like that. All this information is new and we’re still learning how to use it — at-bat by at-bat exit velocity updates are the worst thing on Twitter these days — but it’s all really neat and interesting.
One of these fun new Statcast tools is “perceived velocity,” which measures how fast a pitch “plays” when factoring in things like extension and release point. We’ve all seen pitchers with a 92 mph fastball who get hitters to react like it’s 95 mph, and vice versa. Here is the perceived velocity definition from MLB.com’s glossary:
Perceived Velocity is an attempt to quantify how fast a pitch appears to a hitter, by factoring the Velocity of the pitch and the release point of the pitcher. It takes Velocity one step further — because a 95 mph fastball will reach a hitter faster if the pitcher releases the ball seven feet in front of the rubber instead of six.
To attain Perceived Velocity, the average Major League “Extension” must first be obtained. Any pitcher who releases the ball from behind the average Extension will have a lower Perceived Velocity than actual Velocity. On the other hand, if a pitcher releases the ball from in front of the average Extension, he’ll have a higher Perceived Velocity than actual Velocity.
Perceived velocity seems pretty important, right? More important than actual velocity, I think. Since the start of last season the league average fastball velocity is 92.5 mph while the league average perceived velocity is 92.1 mph. That’s not a negligible difference. There’s much more to it than the raw radar gun reading.
So, with an assist from Baseball Savant, let’s look over the Yankees’ pitching staff and compare average fastball velocities to perceived fastball velocities. These are numbers since the start of last season to give us the largest sample possible.
The Starters
| Average Velocity | Perceived Velocity | “Gain” | |
|---|---|---|---|
| CC Sabathia | 89.96 | 90.93 | +0.97 |
| Michael Pineda | 93.42 | 93.65 | +0.23 |
| Luis Severino | 95.83 | 95.47 | -0.36 |
| Masahiro Tanaka | 91.81 | 91.03 | -0.78 |
| Nathan Eovaldi | 97.29 | 96.43 | -0.86 |
| Ivan Nova | 93.31 | 92.32 | -0.99 |
There are some pretty big differences between average velocity and perceived velocity in the rotation. Sabathia is a big man with a long stride, so it makes sense his fastball plays up and appears faster than what the radar gun tells you. He’s releasing the ball that much closer to home plate. Of course, a 90.93 mph perceived velocity is still well below the league average, but that’s what Sabathia has to work with at this point of his career.
On the other end of the spectrum is Nova, who is unable to gain any extra velocity through extension despite being 6-foot-4. His fastball looks a full mile an hour slower to the hitter than what the radar gun says. The ability to see the ball well out of Nova’s hand has always been a knock against him. He doesn’t have much deception in his delivery and the perceived velocity data suggests he lacks extension too. That’s why Nova’s always been more hittable than his stuff would lead you to believe.
The same is true of Eovaldi, though he brings much more raw velocity to the table than Nova and most other starting pitchers. Eovaldi is not as tall as most of his rotation mates (6-foot-2) so his stride isn’t as long, which costs him some perceived velocity. He’s the poster child for pitchers with big fastballs and small results. His new splitter has really made a big difference because it gives hitters something else to think about. Before they could zero in on the fastball.
I have nothing to back this up, but the 0.78 mph difference between Tanaka’s average fastball and perceived fastball seems to matter less to him than it would other pitchers. Tanaka is basically a splitter/slider pitcher with a show-me fastball. Nova and Eovaldi rely on their fastballs much more heavily because their secondary pitches aren’t as good. I don’t mean that as a knock. Most pitchers rely on their heater. Tanaka’s an outlier. The lack of perceived velocity could help explain why he’s so homer prone though.
The Relievers
| Average Velocity | Perceived Velocity | “Gain” | |
|---|---|---|---|
| Andrew Miller | 94.60 | 95.41 | +0.81 |
| Aroldis Chapman | 99.92 | 100.32 | +0.40 |
| Dellin Betances | 97.49 | 97.65 | +0.16 |
| Chasen Shreve | 91.85 | 91.28 | -0.57 |
| Kirby Yates | 93.16 | 92.05 | -1.11 |
These five guys have been the constants in the bullpen this season. The other two spots — sometimes it has been three other spots — have been used as shuttle spots to cycle arms in and out as necessary.
The big three all gain some velocity through their release points because they’re all so damn tall. I’m actually sort of surprised the difference between Betances’ average fastball velocity and perceived fastball velocity is so small, relatively speaking. He has such a massively long stride …
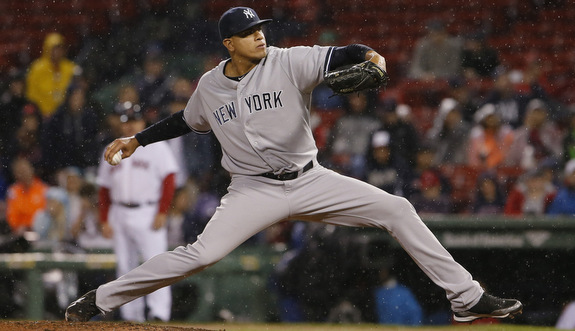
… that you’d think his fastball would play up. Then again, it’s not where your leg lands, it’s where you release the ball. Miller has those long lanky arms and he seems to sling his pitches towards the batter, and those long limbs and funky angles make his already speedy fastball seem ever faster. Same with Chapman. Good grief. His fastball somehow looks faster to the hitter than the radar gun reading. That can’t be fun.
Yates is pretty interesting. He’s listed at 5-foot-10 and he has that compact little delivery, so his fastball looks much slower to the hitter than what the radar gun tells us. That said, Yates is not a reliever who tries to throw the ball by hitters. His key to his success is his slider, which he throws nearly 40% of the time. The fastball may play down according to perceived velocity, but he’s not trying to get guys out with the heater anyway. It’s all about the slider with Kirby.
Miscellaneous Arms
| Average Velocity | Perceived Velocity | “Gain” | |
|---|---|---|---|
| Branden Pinder | 92.25 | 94.35 | +2.10 |
| Bryan Mitchell | 95.67 | 96.57 | +0.90 |
| Chad Green | 94.43 | 95.32 | +0.89 |
| Nick Rumbelow | 93.60 | 93.90 | +0.30 |
| Nick Goody | 91.54 | 91.54 | +0.00 |
| James Pazos | 94.16 | 93.59 | -0.57 |
| Jacob Lindgren | 89.78 | 89.20 | -0.58 |
| Luis Cessa | 92.53 | 91.62 | -0.91 |
| Johnny Barbato | 95.28 | 93.54 | -1.74 |
These are the so-called shuttle pitchers, some of whom haven’t pitched in the big leagues at all this season due to injury. The samples are all very small — Mitchell leads the group with 298 fastballs thrown since the start of last year, and in some cases (Green, Pazos, Cessa, Lindgren) we’re looking at 60 or fewer fastballs — so these numbers are FYI only. There’s something to look at that, not something that should be taken seriously right now.
The numbers are on the extremes are pretty fascinating. Statcast says Pinder’s fastball has played more than two full miles an hour faster than what the radar gun says. Barbato is the opposite. His fastball plays down nearly two miles an hour. Pinder is listed at 6-foot-4 and Barbato at 6-foot-1, so there’s a big height difference, but look at their strides too (you can click the image for a larger view):
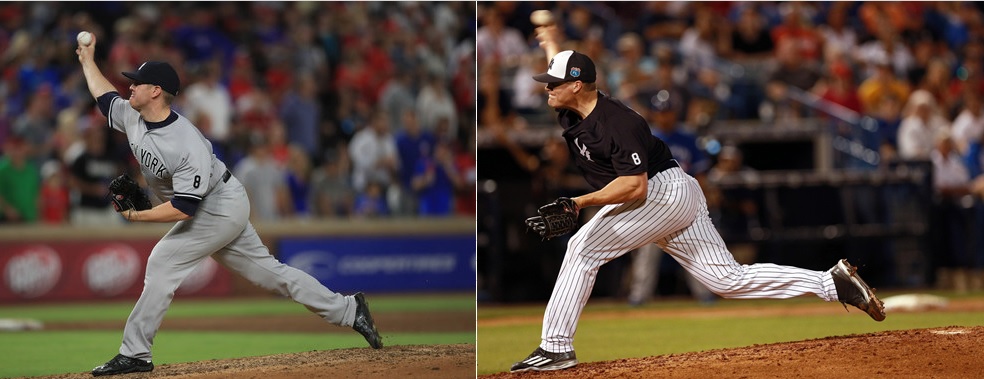
I know this is amateur hour with the photos, sorry. In my defense, it’s really tough to find photos of up and down relievers who have thrown a combined 41.2 innings in the big leagues.
Anyway, you can still kinda see the differences in their strides with those two photos. Both are about to release the ball, yet Pinder is so much closer to the plate that his back foot is already disconnected from the rubber. Look at the angles of their legs too. Barbato is standing a bit more upright, which means he’s not striding as far forward.
Just like regular old velocity, perceived velocity alone is not the key to pitching, but it is definitely part of the equation. Those extra miles an hour — or, to be more precise, the appearance of those extra miles an hour — disrupt timing and give hitters less time to react. Mike Fast once showed a difference of one mile an hour of velocity equates to roughly one-quarter of a run of ERA.
Perceived velocity still doesn’t tell us why Eovaldi’s fastball is less effective than Miller’s, for example. Eovaldi’s heater has Miller’s beat in terms of both average and perceived velocity. I do find it interesting someone as tall as Sabathia can “add” a mile per hour to his heater with his size while a short pitcher like Yates “losses” a mile an hour. Intuitively it all makes sense. It’s just cool to be able to put some numbers on it now.
